Accessing ROI Pixel Arrays
A typical craterpy workflow defines regions of interest (ROIs) around craters and computes zonal statistics over a raster with get_stats. Sometimes you want the raw pixel values inside each ROI so you can run your own analysis (custom statistics, histograms, masking, etc.). get_arrays returns those underlying values as masked arrays.
Here we use the sample data files moon_craters_km.csv crater list and moon.tif image from craterpy.sample_data.
from craterpy import CraterDatabase, sample_data

craters = sample_data["moon_craters_km.csv"]
moon_tif = sample_data["moon.tif"]

cdb = CraterDatabase(craters, "moon", units="km")
cdb
/home/docs/checkouts/readthedocs.org/user_builds/craterpy/checkouts/latest/craterpy/helper.py:20: TqdmExperimentalWarning: Using `tqdm.autonotebook.tqdm` in notebook mode. Use `tqdm.tqdm` instead to force console mode (e.g. in jupyter console)
  from tqdm.autonotebook import tqdm
CraterDatabase of length 786 with attributes lat, lon, rad, center.
Add a rim annulus region (1 to 1.5 crater radii past the rim), then compute zonal statistics over the raster as usual with get_stats.
cdb.add_annuli("rim", 1, 1.5)
stats = cdb.get_stats(moon_tif, "rim")
stats.head()
| Diameter (km) | Latitude | Longitude | mean_rim | count_rim | std_rim | |
|---|---|---|---|---|---|---|
| 0 | 1145.53 | 34.72 | -14.91 | 59.517785 | 14844 | 14.817788 |
| 1 | 996.84 | -47.77 | 91.99 | 85.994535 | 13907 | 32.254453 |
| 2 | 875.75 | 8.35 | 30.83 | 64.427007 | 7124 | 20.342053 |
| 3 | 840.35 | -7.83 | 53.67 | 68.585645 | 6562 | 17.622045 |
| 4 | 714.50 | -20.59 | -17.29 | 68.183126 | 5073 | 22.664615 |
Accessing the underlying arrays
get_arrays takes the same arguments as get_stats, but each cell holds the numpy.ma.MaskedArray of pixel values clipped to that crater’s ROI instead of a single statistic.
arrays = cdb.get_arrays(moon_tif, "rim")
roi = arrays["rim"].iloc[0]
print(type(roi), roi.shape)
roi
<class 'numpy.ma.MaskedArray'> (162, 201)
masked_array(
  data=[[--, --, --, ..., --, --, --],
        [--, --, --, ..., --, --, --],
        [--, --, --, ..., --, --, --],
        ...,
        [--, --, --, ..., --, --, --],
        [--, --, --, ..., --, --, --],
        [--, --, --, ..., --, --, --]],
  mask=[[ True,  True,  True, ...,  True,  True,  True],
        [ True,  True,  True, ...,  True,  True,  True],
        [ True,  True,  True, ...,  True,  True,  True],
        ...,
        [ True,  True,  True, ...,  True,  True,  True],
        [ True,  True,  True, ...,  True,  True,  True],
        [ True,  True,  True, ...,  True,  True,  True]],
  fill_value=np.uint64(999999),
  dtype=uint8)
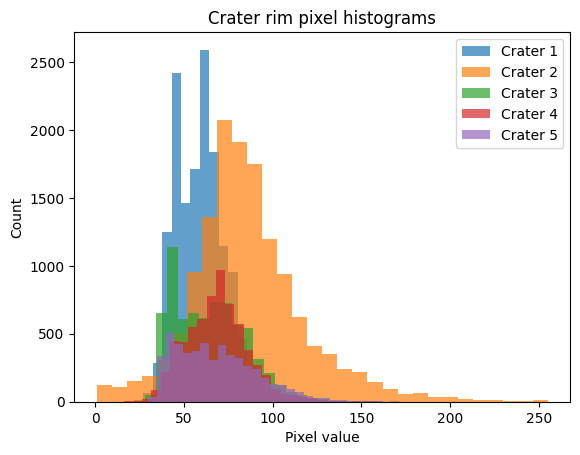
Now you can do anything you like with the pixels. For example, compute a custom statistic (here the 90th percentile of valid pixels) for every crater, or plot the value distribution of one ROI.
import numpy as np

# Custom per-crater statistic from the raw arrays
p90 = arrays["rim"].apply(lambda a: np.percentile(a.compressed(), 90))
p90.head()
0     78.0
1    126.0
2     92.0
3     90.0
4     99.8
Name: rim, dtype: float64
import matplotlib.pyplot as plt

for i in range(5):
    roi = arrays["rim"].iloc[i]
    plt.hist(roi.compressed(), bins=30, histtype="stepfilled", alpha=0.7, label=f"Crater {i+1}")
    plt.xlabel("Pixel value")
    plt.ylabel("Count")
plt.title(f"Crater rim pixel histograms");
plt.legend()
<matplotlib.legend.Legend at 0x7522aa8396a0>